Effective August 17, 2023, services are suspended.  Please contact cais@uga.edu to request lab status updates.

Since nucleons (protons and neutrons) weigh approximately 1 unit on the scale used to measure such things, the atomic weight of an atom can be treated as the same as the number of its nucleons. That the atomic weights of many of the elements listed in tables are not neat whole numbers shows that these weights are averages of the differing atomic weights of two or more forms. A chemical element’s atomic number is the number of positive charges (the number of protons) in the nucleus of each of its atoms. This number is the defining characteristic of a given element, invariant for all atoms of that element. Thus if some atoms of an element have a different atomic weight from others, the difference must lie in the number of neutrons. Atoms of the same atomic number but different atomic weights are called isotopes. Elements can exist in both stable and unstable (radioactive) forms. Most elements of biological interest (including C, H, O, N, and S) have two or more stable isotopes, with the lightest of these present in much greater abundance than the others. Among stable isotopes the most useful as biological tracers are the heavy isotopes of carbon and nitrogen. These two elements are found in the earth, the atmosphere, and all living things. Each has a heavy isotope (13C and 15N) with a natural abundance of ~1% or less and a light isotope (l2C and 14N) that makes up all of the remainder, in the case of nitrogen, or virtually all in the case of carbon (carbon also has a radioactive isotope, 14C.)

STABLE ISOTOPE ECOLOGY LABORATORY


Learn More About the Stable Isotope Ecology Laboratory

Measurement Notation

Atom Percent:

Results from environmental and agricultural studies using isotopically enriched tracers are usually reported in units of atom percent (At%). This value gives the absolute number of atoms of a given isotope in 100 atoms of total element:

(N.B., for the At%13C calculation the amount of naturally present 14C is usually treated as negligible and the sum of 12C and 13C taken to be total C).

Atom Percent Excess:

Medical tracer studies of human physiology are most often reported in units of atom percent excess (APE). This specifies the level of isotopic abundance above a given background reading, which is considered zero. The background reading in At% is subtracted from the experimental value to give APE.

Delta:

Studies examining stable isotopes at or near natural abundance levels are usually reported as delta, a value given in parts per thousand or per mil (“o/oo“).

Delta values are not absolute isotope abundances but differences between sample readings and one or another of the widely used natural abundance standards which are considered delta = zero (e.g. air for N, At%15N = 0.3663033; Pee Dee Belemnite for C, At%13C = 1.1112328). Absolute isotope ratios (R) are measured for sample and standard, and the relative measure delta is calculated:

Where:

For instance, if a leaf sample is found to have a 15N/14N ratio R greater than the standard’s by 5 parts per thousand, this value is reported as delta15N = +5 delta o/oo.

The transformation of absolute At% values into relative (to a certain standard) delta values is used because the absolute differences between samples and standard are quite small at natural abundance levels and might appear only in the third or fourth decimal place if At% were reported.

Tracing and Fractionation

Tracing studies

For biological tracing, labelled compounds are available with the heavy isotope making up 99% of the tracer element (e.g. 99 At% 13C-amorphous carbon, Sigma Chemical Co. 27,720-7; 99 At% 15N-ammonium sulfate, Sigma 29,928-6). To biologists the principal advantage of stable isotopes over other tracers is that they are not radioactive. 14C is somewhat hazardous and subject to a great many regulations and licensing requirements; for N there is no convenient radioactive nuclide.

Isotopic fractionation

Isotopes of the same element take part in the same chemical reactions, but because the atoms of different isotopes are of different sizes and different atomic weights they react at different rates. Physical processes such as evaporation discriminate against heavy isotopes; and enzymatic discrimination and differences in kinetic characteristics and equilibria can result in reaction products that are isotopically heavier or lighter than their precursor materials. The naturally occurring delta13C values for biologically interesting carbon compounds range from roughly 0o/oo to ~-110o/oo relative to the Pee Dee Belemnite (PDB) standard. C3 plants, those using the Calvin-Benson photosynthetic pathway, fractionate carbon differently from C4 plants that use the Hatch-Slack pathway. The different 13C/12C ratios that result can be used to distinguish C3 from C4 plants. The tissues of animal grazers reflect the plants on which they feed, and this can be used to make inferences about diet both at present and in the archaeological record. Natural 15N levels in biological materials typically range from ~-5o/oo to ~+10o/oo. Grazing animals show 15N enrichment relative to the plants they consume; predators show further 15N enrichment relative to their prey species. Atmospheric N is isotopically lighter than plant tissues, and soil 15N values tend to be higher still, suggesting that microbes discriminate against the light isotope during decomposition. Non-nitrogen-fixing plants, which derive all their N from the soil N pool, can thus be expected to be isotopically heavier than nitrogen-fixing plants, which derive some of their N directly from the atmosphere.

Standard materials and calibrants

The five principal light elements of biological interest are measured against four widely accepted standards:
H, O – Standard Mean Ocean Water (SMOW)
C, O – Pee Dee Belemnite (PDB)
N – atmospheric air
S – the Canyon Diablo meteorite (CD)

The natural abundance of 15N in air is a constant 0.3660%; air, being thus suitable as well as omnipresent and free, is used as the standard for nitrogen analyses.

The common reference for delta13C, the Chicago PDB Marine Carbonate Standard, was obtained from a Cretaceous marine fossil, Belemnitella americana, from the PeeDee formation in South Carolina. This material has a higher 13C/12C ratio than nearly all other natural carbon-based substances; for convenience it is assigned a delta13C value of zero, giving almost all other naturally-occurring samples negative delta values.

All original supplies of both SMOW and PDB have been used up and replaced by secondary standards prepared by the U.S. National Bureau of Standards (for instance NBS-21 graphite, having a carbon isotope ratio of -28.10o/oo compared to PDB) and the International Atomic Energy Agency, including V-SMOW (Vienna SMOW), which has an isotopic composition nearly duplicating original SMOW, and SLAP (standard light antarctic precipitation). The supply of air has not yet been exhausted (but stay tuned.)

Applications and uses of Stable Isotopes

I. Tracing studies:

Nitrogen cycling: To investigate nitrogen cycling in crop plants, 15N-labelled fertilizer (urea, ammonium nitrate, and so on) either 2-5% enriched or 0.36% depleted in 15N is applied. Following the tracer yields data with which one can quantify the fate of the added fertilizer N as it passes into various partitions: the portion taken up by the plants, the portion remaining in the soil N pool, the portion lost by denitrification into the atmosphere, and the portion leached into runoff waters. Such data leads to recommendations for fertilization that yield the greatest benefit to food crops and the least possible pollution of drinking water by nitrate runoff. 15N levels in the soil and water can also be an indication of the origin of the N, pinpointing its source.

Physiological tracing: Medical researchers use 13C as a noninvasive alternative to 14C for analyzing metabolic processes. 13C-labeled compounds metabolize to 13CO2, which is detectable in the breath.

II. Fractionation studies:

Nitrogen fixation: Since soil N is often more abundant in 15N than the atmosphere, and non-N-fixing plants must obtain all their nitrogen from the soil while N-fixing plants have an alternative N source in the form of (isotopically lighter) air, it is expected that N-fixing and non-fixing plants will differ in their 15N values. The lighter (more negative delta) the plant material is found to be with respect to soil N, the better its N-fixing ability. This difference forms the basis for the 15N natural abundance technique of estimating symbiotic N. N-fixation can also be quantified using tracer methods, and tracer techniques are more popular for examining N-fixation in crop plants. The natural abundance method has found an increasing number of applications by ecologists studying natural, nonmanaged ecosystems.

Photosynthesis and carbon cycling: Terrestrial plants fix atmospheric CO2 by two main photosynthetic reaction pathways: the Calvin-Benson, or C3, and the Hatch-Slack, or C4. C3 plants convert atmospheric CO2 to a phosphoglycerate compound with three C atoms while C4 plants convert CO2 to dicarboxylic acid, a four-C compound. Carbon isotopes are strongly fractionated by photosynthesis and the C3 and C4 processes involve different isotopic fractionation, with the result that C4 plants have higher delta13C values ranging from -17o/oo to -9o/oo with a mean of -13o/oo relative to PDB, while C3 plants show delta values ranging from -32o/oo to -20o/oo with an average value of -27o/oo. Most terrestrial plants are C3, all forest communities and most temperate zone plant communities of all kinds being dominated by C3 plants. The native plant populations of North America and Europe are almost exclusively C3. Over 80% of crop plants are C3.

C4 plants are characteristically found in hot, arid environments: a selective advantage of C4 photosynthesis is more efficient use of water. Some crops of immense importance are C4 plants: maize, sorghum, millet, and sugar cane. The 13C value is a standard method for distinguishing the C3 and C4 plant groups and is used by plant physiologists to determine drought resistance in C3 plants, as well as to breed for improvement in this increasingly vital characteristic.

III. Archaeological investigations:

As mentioned above, the characteristic isotope-ratio “signatures” of food species are passed on to consumers. Though there may be further fractionation during metabolic processing of food by the consumers, the mean delta13C values of the two main groups, C3 and C4, of primary producers can remain visible through many trophic levels to the top of the food chain. It is possible to determine the proportion of C3 and C4 plant species in the diet of herbivores and to make inferences about the prey species selected by carnivores. A remarkable application of this fact depends on the further observation that original North American plant communities were composed almost exclusively of C3 species (mean delta13C = -27o/oo), while maize (Zea mays) is a C4 plant with a delta13C value of -14o/oo. It has proven possible to determine the time of introduction of maize agriculture in the New World, and the rate at which it was adopted, by examining the delta13C values of skeletons and carbonized deposits in cooking pots. During the period A.D 1000-1200, the delta values of human collagen recovered from skeletal material changed from -21.4o/oo to -12o/oo as the isotope content of the diet was altered by the introduction of maize. This in turn can now be correlated with the great changes in population density and levels of civilization that resulted from the abandonment of the hunter-gatherer mode of life and the substitution of long-term agricultural settlements.

IV. Correction of carbon-14 dates:

Since carbon is strongly fractionated by biological processes, it is not possible to date ancient carbon-bearing material by the carbon-14 method without taking this fractionation into account. If biological samples selectively accumulate heavy C isotopes, this will make them appear spuriously young. It has been found that rates of 13C stable isotope fractionation are doubled for 14C. Stable isotope analysis gives an independent measure of fractionation such that if, for instance, a sample is 1.5% heavier in 13C than “modern standard carbon” through the effects of fractionation, then it will be 3% heavier in 14C than it would have been had fractionation not taken place. Since the average lifetime of a 14C atom is ~8000 years, a 3% increase in 14C content through fractionation will make it appear too young by 3% of 8000 years, or 240 years.

Mass Spectrometry Overview

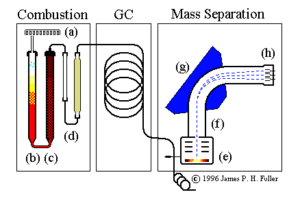
The mass analysis train operated by this laboratory includes the components shown above. These are discussed in the following text.

Combustion subsystem:

  • sample dropper (a)
  • combustion column (b)
  • reduction column (c)
  • gas traps (water and optionally CO2) (d)

Gas chromatograph subsystem:

Mass separation subsystem:

  • ion beam source (e)
  • flight tube (f)
  • magnetic beam deflector (g)
  • signal detectors (h)

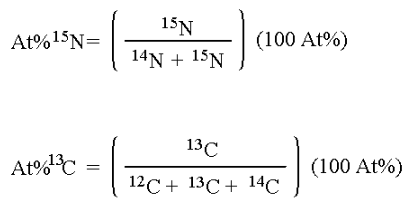
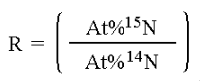
A sample’s isotopic composition is measured by determining the ratios of the stable isotope masses being examined – in the case of this laboratory, 15N/14N or 13C/12C as appropriate. These ratios are measured on an isotope ratio mass spectrometer, a device that separates ions of the element of interest on the basis of their differing mass/charge ratio (m/z).

Combustion

Sample preparation consists of converting solid or liquid material to a gas and isolating the particular gas that must be analyzed (N2 or CO2.) In the machine diagramed at the top of this page a rotating multiplace sample dropper (a) delivers one sample at a time into the top of a quartz combustion tube (b). This tube contains granulated chromium III oxide combustion catalist and is held at 1200 degrees C. A pulse of pure O2 is admitted with each sample. All combustible materials in the sample are flash-burned and the resulting gaseous combustion products are swept out the bottom of the tube by a constant stream of nonreactive helium carrier gas.

All carbon in tha sample is converted by combustion to CO2. Nitrogen-bearing combustion products include N2 gas and various oxides of nitrogen NOx. The gasified sample passes from the combustion tube into another furnace (c) containing fine copper granules at 650 degrees C. In this furnace all molecules of NOx give up their oxygen to the hot copper and emerge as pure N2.

Water vapor from the sample is removed by a gas trap (d) containing magnesium perchlorate. If the samples are being analyzed for nitrogen isotopes only, CO2 is removed by a second gas trap containing a CO2 scrubber (sodium hydroxide on silicate carrier granules).

GC Peak Separation

The clean sample gases now pass through a gas chromatograph column (shown in the diagram block labelled GC) to separate the N2 and CO2 and permit these to reach the mass spectrometer at different times. N2 elutes from the GC column first, then CO2.

Mass Separation

A needle-type splitter valve admits a small portion of the pure gases (~1%) into one end of a highly evacutaed flight tube. A hot filament in the ion source (e) generates a beam of electrons; molecules of N2 or CO2 are ionized by the impact of these electrons. These ions are collimated into a focused beam and accelerated into the flight tube (f). The ion beam enters a strong magnetic field created by an electromagnet (g) which performs the actual mass separation. Ions in the field are deflected into circular paths whose radii are proportional to their masses. Each ion is subject to a centripetal force.

HeV

where
H = magnetic field strength
e = ion charge
V = velocity.

Counteracting this is the ion’s centrifugal force

mV^2/r

where
m = mass
V = velocity
r = radius of curvature.

Solving, we obtain the radius r of each ion’s path:

mV^2r = HeV

r = mV / eH

Or, to paraphrase in English, light ions are deflected more and heavier ones less. The result is that the ion beam is divided into its component masses.

The separated masses finally reach collectors (Faraday cups) at (h), placed so as to receive masses 28, 29, and 30 for dinitrogen or 44, 45, and 46 for carbon dioxide. Here the impact of the ions is translated into a recordable signal that is collected for data processing and analysis. The absolute levels of the signals depend on the amount of gas which is admitted into the ion source. The critical value is the ratio of the signals falling into the different collector cups.

Standard materials and calibrants

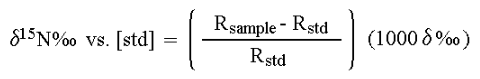
In stable isotope analysis, calibration is made against reference materials chosen to have an isotopic abundance and total-element composition (nitrogen or carbon content and carbon-to-nitrogen ratio) similar to the expected values range for the samples. It has been found that measuring the absolute isotopic composition of a sample is not usually as reliable or convenient as measuring isotopic differences between a sample and an appropriate standard. This technique of differential comparison of sample and standard provides high precision and repeatability over both short-term and long-term periods and permits determination of very small differences in the isotopic composition of two samples. To evaluate very small differences in isotopic composition between samples and standards, the isotope ratios of both are determined by mass spectrometry. For example, in 13C analysis the sample is converted to CO2 gas before analysis. Various combinations of the isotopes of C and O can create molecules of the masses shown below but, as will be evident from summing the percentages of the total CO2, only the mass ratios 45/44 and 46/44 need be determined. Though absolute mass ratios are measured, the principle interest lies in the difference between the sample and standard ratios.

Sample prep considerations

Biological materials analyzed for stable isotope content include leaves, roots, soil, plasma and other solid and liquid substances. Before samples can be analyzed by they must be converted into the simple gases N2 or CO2. The micro-Dumas combustion elemental analyzer used here as a front end for the mass spectrometer requires some care in preliminary sample preparation (though considerably less than wet-chemistry techniques such as Kjeldahl-Rittenberg.)

1. Solid samples must be oven-dried (80 degrees C, 24 hours). Freeze-drying must be used if the samples contain forms of N such as ammonia that would lost in oven-drying.

2. Dried samples are ground to talcum powder consistency (250 um or less) using a ball mill (e.g. Spex Industries 8000) before being sealed into 5 x 9 mm tin capsules. Thorough sample homogenization in the grinder stage is required, to make certain that the tiny subsample taken for analysis (e.g. ~2 mg for 13C in leaves) is representative of the total sample. Poor precision can often be traced to inadequate grinding that leaves fibrous matter or visible granules in the sample. Wiley mills do not do an acceptable job of grinding for this application. (Nor does that favorite of low-budget improvization, the home coffee mill.)

3. Combustion capsule formation is critical for successful analytical runs. Please refer to the detailed [sample encapsulation] instructions for further information.

4. All mass spectrometers show a confounding effect of sample size on determined isotope ratio. Samples are therefore weighed after grinding to achieve a uniform sample size. (If total C or N values are desired in addition to 13C/15N, these weights are recorded and used in the data analysis.)

For isotopic analysis, sample size and total element content have a major effect on the analysis. The size of the subsample weighed out depends upon the density of the material as well as its N and C content. An ideal soil or plant sample intended for natural abundance isotopic analysis at this lab would contain 200 micrograms total N and 800 micrograms total C. It may not, of course, be possible to provide both these ideal amounts in one sample. The lower limits for reliable day-to-day operation of our instrument at natural abundance isotope levels appear to be ~25 micrograms total N and ~200 micrograms total C. For best precision and accuracy a preliminary analysis for total element content should be performed so that standards may be closely matched to samples.

Another sample-size constraint is related to the absolute amount of material that can be completely combusted in micro-Dumas apparatus. The maximum burnable total C content is around 2500 micrograms (e.g., for NBS 1572 citrus leaf standard, which is 43.27% C, this works out to a maximum sample size of 5.8 mg of ground leaf.) If, for example, a given sample is so poor in N that it must contain > 2500 ug C in order to achieve 25 ug N then it is essentially not analyzable for 15N. In addition, for element-poor soil samples the sheer bulk of the sample becomes significant. Soil samples of over 50 mg are very difficult to analyze due to rapid ash buildup in the furnace.

5. Nitrogen diffusion samples frequently fall at the lower end of the acceptable range of total N content. There is a small-sample mode available for samples containing less than 50 ug total N and no C. In this mode the oxygen pulse added to improve combustion, which as mentioned earlier contains a trace N impurity, is injected between samples rather than with them. Enough oxygen for a small sample is retained by the combustion catalyst, and this retained oxygen is of course free of the N2 impurity. Small-sample mode removes the need for baseline blanks and the variability these blanks add to the analytical process. However, in order to use this mode of operation we must know ahead of time that a given sample set will consist exclusively of low-N, no-C samples.

6. Liquid samples may be analyzed either by freeze-drying directly into a tin capsule or pipetting onto an inert absorbant substrate.

Encapsulation

Combustion capsule formation

Sample droppers are mechanical devices that can malfunction with poorly formed sample capsules. The forming device shown below does a very good job of compressing sample material in tin capsules into neat little cylinders (like the one in the lower right in the illustration) that will not jam. Vendors of supplies for elemental analyzers will happily sell you one of these devices machined from stainless steel — similar devices can be improvised from a block of plastic, a nail, a drill and a little ingenuity.

N.B. a sample tin mushed up into a ball with nothing but tweezers will jam!

Capsule Organization

When a large number of such sample capsules are needed, the question of how to manage and identify them arises. One tiny encapsulated sample tends to look much like another. A convenient solution is to store one capsule in each well of a 96-well plastic cell-culture (or microtiter, or eliza) plate, which is manufactured with the rows labelled A-H and the columns numbered 1-12, and keep a separate key stating that well A1 contains sample 1, A2 contains sample 2 and so on. These plates are costly when new because they are sterile. For managing tins, however, clean used plates are quite acceptable.

Video Instructions for Tin Capsule Preparation


EPA Sample Preservation Guidelines

Excerpt from manual:

U. S. Environmental Protection Agency. 1983. Sample preservation. pp.xv-xx. In Methods for Chemical Analysis of Water and Wastes, EPA-600/4-79-020. U.S.E.P.A., Cincinnati, Ohio, USA.

Complete and unequivocal preservation of samples, either domestic sewage, industrial wastes, or natural waters, is a practical impossibility. Regardless of the nature of the sample, complete stability for every constituent can never be achieved. At best, preservation techniques can only retard the chemical and biological changes that inevitably continue after the sample is removed from the parent source. The changes that take place in a sample are either chemical or biological. In the former case, certain changes occur in the chemical structure of the constituents that are a function of physical conditions. Metal cations may precipitate as hydroxides or form complexes with other constituents; cations or anions may change valence states under certain reducing or oxidizing conditions; other constituents may dissolve or volatilize with the passage of time. Metal cations may also adsorb onto surfaces (glass, plastic, quartz, etc.), such as, iron and lead. Biological changes taking place in a sample may change the valence of an element or a radical to a different valence. Soluble constituents may be converted to organically bound materials in cell structures, or cell lysis may result in release of cellular material into solution. The well known nitrogen and phosphorus cycles are examples of biological influence on sample composition. Therefore, as a general rule, it is best to analyze the samples as soon as possible after collection. This is especially true when the analyze concentration is expected to be in the low ug/1 range.

Methods of preservation are relatively limited and are intended generally to (1) retard biological action, (2) retard hydrolysis of chemical compounds and complexes, (3) reduce volatility of constituents, and (4) reduce absorption effects. Preservation methods are generally limited to pH control, chemical addition, refrigeration, and freezing.

The recommended preservative for various constituents is given in Table 1. These choices are based on the accompanying references and on information supplied by various E.P.A. Quality Assurance Coordinators. As more data become available, these recommended holding times will be adjusted to reflect new information. Other information provided in the table is an estimation of the volume of sample required for the analysis, the suggested type of container, and the maximum recommended holding times for samples properly preserved.

  1. More specific instructions for preservation and sampling are found with each procedure as detailed in the EPA manual. A general discussion on sampling water and industrial wastewater may be found in ASTM, Part 31, p. 72-82 (1976) Method D-3370.
  2. Plastic (P) or Glass (G). For metals, polyethylene with a polypropylene cap (no liner) is preferred.
  3. Sample preservation should be performed immediately upon sample collection. For composite samples each aliquot should be preserved at the time of collection. When use of an automated sampler makes it impossible to preserve each aliquot, then samples may be preserved by maintaining at 4 deg. C until compositing and sample splitting is completed.
  4. When any sample is to be shipped by common carrier or sent through the United States Mails, it must comply with the Department of Transportation Hazardous Materials Regulations (49 CFR Part 172). The person offering such material for transportation is responsible for ensuring such compliance. For the preservation requirements of Table I the Office of Hazardous Materials, Materials Transportation Bureau, Department of Transportation has determined that the Hazardous Materials Regulations do not apply to the following materials: Hydrochloric acid (HCl) in water solutions at concentrations of 0.04% by weight or less (pH about 1.96 or greater); Nitric acid (HNO3) in water solutions at concentrations of 0.15% by weight or less (pH about 1.62 or greater); Sulfuric acid (H2SO4) in water solutions at concentrations of 0.35% by weight or less (pH about 1.15 or greater); Sodium hydroxide (NaOH) in water solutions at concentrations of 0.080% by weight or less (pH about 12.30 or less).
  5. Samples should be analyzed as soon as possible after collection. The times listed are the maximum times that samples may be held before analysis and still considered valid. Samples may be held for longer periods only if the permittee, or monitoring laboratory, has data on file to show that the specific types of sample under study are stable for the longer time, and has received a variance from the Regional Administrator. Some samples may not be stable for the maximum time period given in the table. A permittee, or monitoring laboratory, is obligated to hold the sample for a shorter time if knowledge exists to show this is necessary to maintain sample stability.
  6. Should only be used in the presence of residual chlorine.
  7. Maximum holding time is 24 hours when sulfide is present. Optionally, all samples may be tested with lead acetate paper before the pH adjustment in order to determine if sulfide is present. If sulfide is present, it can be removed by the addition of cadmium nitrate powder until a negative spot test is obtained. The sample is filtered and then NaOH is added to pH 12.
  8. Samples should be filtered immediately on-site before adding preservative for dissolved metals.
  9. For samples from non-chlorinated drinking water supplies conc. H2SO4 should be added to lower sample pH to less than 2. The sample should be analyzed before 14 days.
Instrumentation
  • EA-IRMS: 4 Carlo Erba NA series analyzers coupled to Thermo Delta C, Plus and 2 Delta V IRMS systems
  • EA-IRMS: 2 Thermo Flash 1000 series analyzers coupled to 2 Thermo Delta V systems
  • EA-Isolink-IRMS: 1 Thermo EA-Isolink (34S) series analyzer coupled to Thermo Delta V system
  • Gas-Bench : 1 Thermo Gas Bench coupled to Thermo Delta V IRMS system
  • Gas-Bench: 1 Thermo Gas Bench/Pre-Con (for ultra high sensitivity) coupled to Thermo Delta Plus IRMS
    system